


![]()
|
|
|
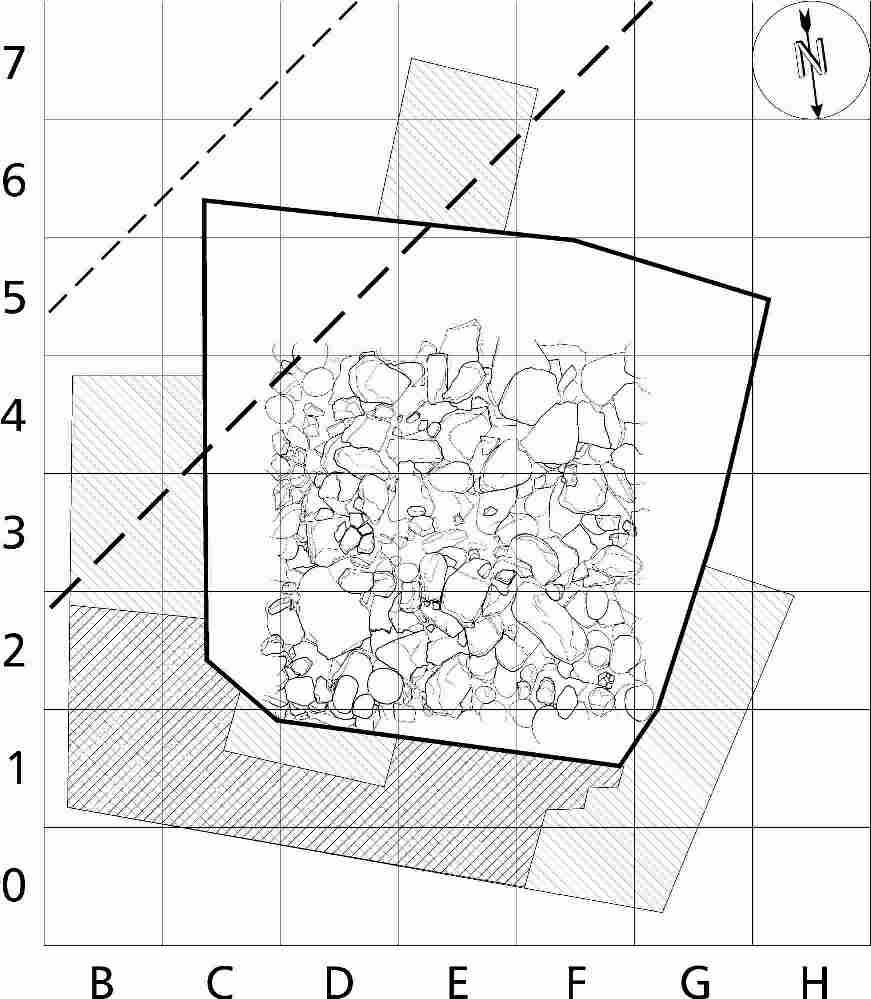
Fig. 33: Synthetic map showing the excavated
surfaces of stone structure B3. The thick line
represents the outer limit of the structure. The hatched areas show the
excavated surfaces around B3 (two different depths: simple hatched areas are
deeper than the crosshatched surface). The stone surface of the structure
is represented in details for the squares D-F/2-4. The oblique dotted
lines represent the future limit of the future RNR-RC building: the thick dotted
line is the initially planned position, whereas the thin dotted line represents
the position after a minimal shifting of the new building. Grid size = 1m. |
|
Copyright 2000 by Blumer R. and Vial F.
|